This blog's content was taken from episode 303, "The Problem with Large RRSP Balances and July ETF Flows"
You can go check out the whole episode here:
| Spotify | Apple Podcasts | The Canadian Investor Podcast Network |
The National Bank comes out with this report every month and it is seen to give us a good overview of where the money is flowing currently.

In July, the money market ETF trend continued for Canadian ETFs.
July:
- There was a total of 3B in inflows for July 2023
- 63% of new inflows were in fixed income
- Just shy of half of all fixed income inflows were in Money Market ETF
- The top ETF in terms of inflows was the ishares emerging market ETF (XSEM)
- The ETF which saw the most outflows was the BMO S&P 500 Index ETF at 379M
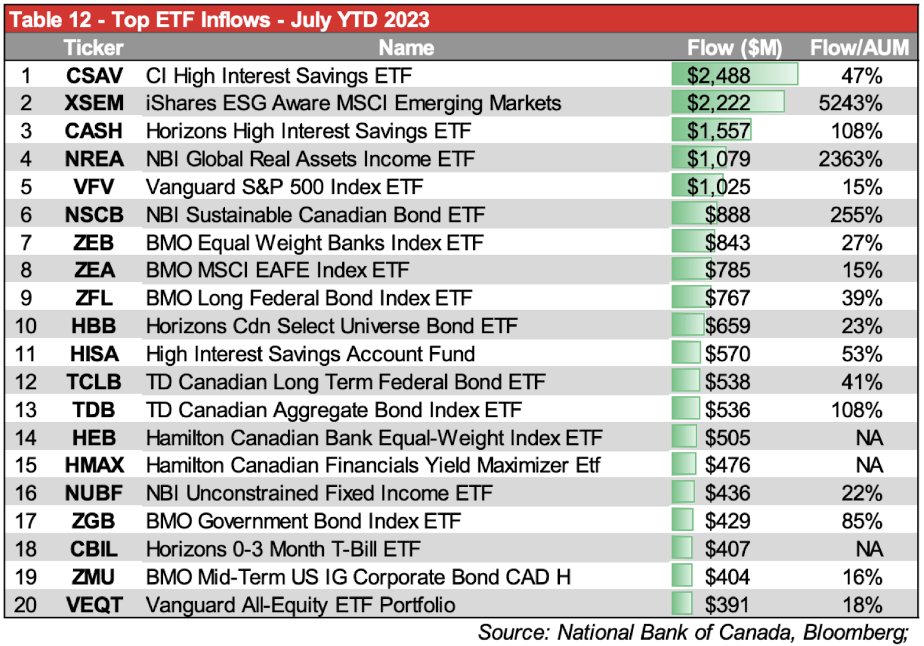
YTD Canadian Data:
- Fixed Income is still dominating inflows YTD at 58% of all inflows.
- Money Market ETFs have 50% of all inflows into fixed income this year
- The BMO S&P 500 ETF is the word ETF by a wide margin in terms of outflows this year. 1.4B has left the fund which is a drop of 15% in AUM. The second most outflows saw 487M in outflows
- CI High interest Savings ETF (CSAV) has seen the most inflows this year at 2.5B followed by the ishares emerging market (XSEM) at 2.2B. Horizons High interest savings ETF (CASH) rounds out the top 3 at 1.6B
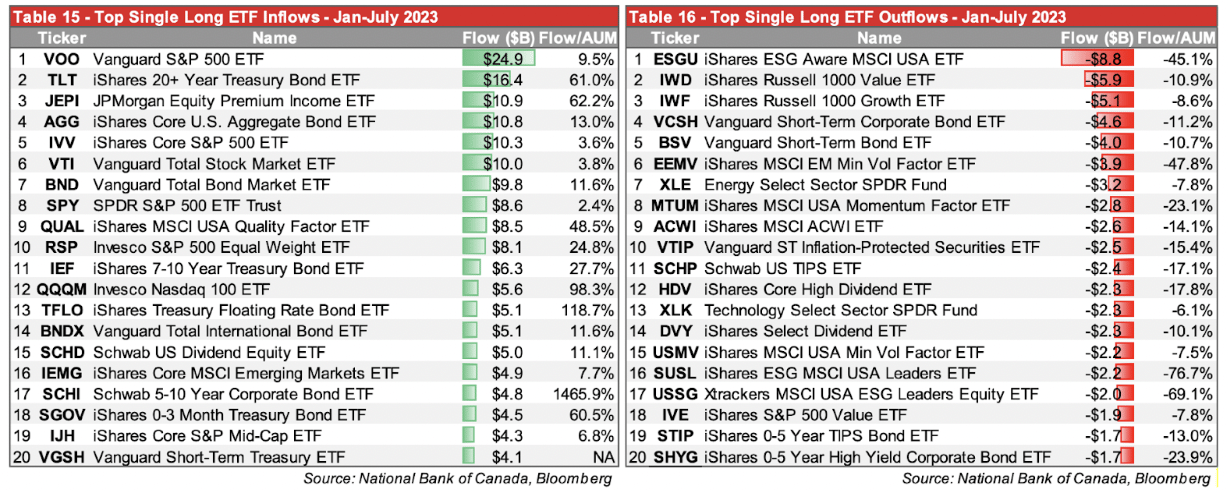
Onto the US Data:
The US data was a bit different than the Canadian data in terms of trends. The US ETF market is much bigger than the Canadian market.
July:
- Total of 54.5B in inflows for July
- The ETF with most inflows in July was the ishares core S&P 500 ETF (IVV) at 10B. It was followed by the ishares 20+ year treasury bond ETF (TLT) had 4.8B in inflows by itself which accounted to 33% of all fixed income inflows.
- That shows the contrast with Canada where in Canada Money market funds were much more popular
- Only 27% of all inflows went to fixed income in the US in July compared to 63% in Canada
- 70% of all inflows went to equity ETFs with 78% of all those going into domestic ETFs
YTD US Data:
- The YTD basis is different with 44% of all inflows going to fixed income and 51% going to ETFs